The Power of Diversity and Inclusion at Work [2026 Study]


Our customers have been hired by:*Foot Note


The topic of diversity and inclusion at work is of ever-increasing importance.
Globalization, technological development, and the pandemic have brought a revolution to the world of work. In today’s interconnected and multicultural labor market, the workforce is more diverse than ever before. Employees from all backgrounds come together to work side by side.
Not surprisingly, diversity and inclusion have become part of the fabric of modern workplaces.
What feelings do they evoke? And how important are they to the average employee?
Let’s start with some recent data on the topic.
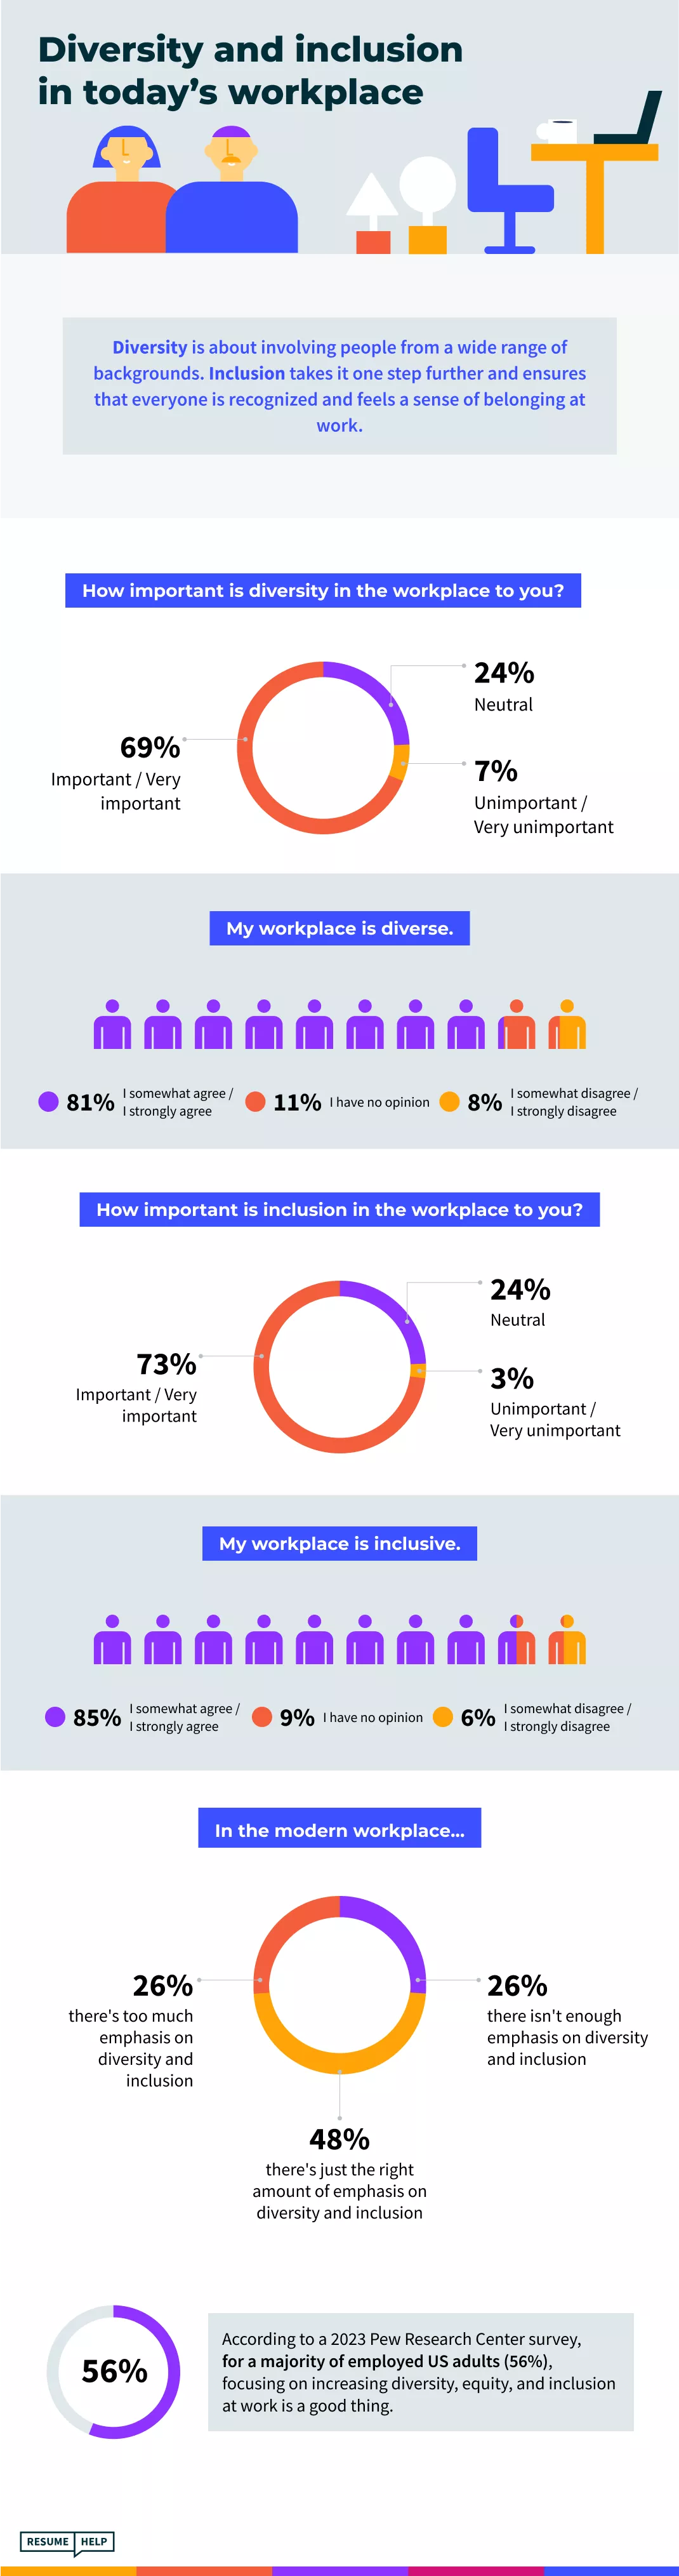
- According to a 2024 Pew Research Center study, most employed US adults (56%) think improving D&I at work is a good thing.
- The Diversity and Inclusion Global Market Report 2022 revealed that diverse companies earn 2.5 times higher cash flow per employee and that inclusive teams get a 35% plus boost in productivity.
- According to a 2021 Glassdoor survey, 76% of employees and job seekers consider a diverse workforce to be essential when evaluating companies and job offers.
- 2020 data from McKinsey research calculated that businesses worldwide spent $7.5 billion on D&I in 2020, an amount that’s expected to double to $15.4 billion by 2026.
D&I is more than just a buzzword. At ResumeHelp, we surveyed over 1000 workers to examine:
- The growing importance of diversity and inclusion for employees in today’s workplace
- Pros and cons of workplace diversity
- Inclusive recruitment best practices
- Prejudices and stereotypes at work
- First-hand experience with discrimination at work
- Views on diversity and inclusion in the modern workplace
Key findings:
- 8 in 10 participants believe inclusive workplaces make us better people.
- 81% consider diversity to be a modern workplace must.
- 77% would quit if they noticed their employer discriminating against employees.
- 82% believe diversity and inclusion contribute to the long-term success of organizations.
- 86% think the hiring process must always be bias-free.
- 77% claim that prejudices and stereotypes harm the overall employee experience.
- 76% admit stereotyping is present in their workplace.
- 61% have felt discriminated against at work because of their appearance.

Diversity and inclusion in today’s workplace
Before we present the results of the study, let’s clarify what diversity and inclusion at work mean.
Diversity is about involving people from a wide range of backgrounds. Inclusion takes it one step further and ensures that everyone is recognized and feels a sense of belonging at work.
As Verna Myers once said, “Diversity is being invited to the party. Inclusion is being asked to dance.” This catchy definition perfectly illustrates how to differentiate the two terms in question.
Now for our findings. To start with, we asked respondents a few questions examining their overall feelings about workplace diversity and inclusion.
- Almost 7 in 10 (69%) participants considered diversity in the workplace as important or very important.
There were noteworthy disparities in answers given within demographic groups, though. Sentiments on the importance of workplace diversity varied as follows. The numbers presented show those who indicated workplace diversity was important or very important.
Age: 25 or younger—76% vs. 26–40 y/o—63%
Ethnicity: ethnic minorities—81% vs. white—68%
Industry: software/IT—77% vs. business & finance—59%
Company size: 201–500 employees—78% vs. 501+—60%
Annual income: $50,000–74,999—76% vs. $75,000 and greater—61%
Education: Master’s degree—72% vs. no college degree—46%
Workplace diversity was seen as most important by ethnic minority representatives (81%), employees of companies hiring 201–500 workers (78%), and participants employed in the software/IT industry (77%). On the other hand, respondents without a college degree considered diversity at work the least important. 23% viewed it as unimportant or very unimportant.
We also asked survey takers if their workplace was diverse.
- 81% of respondents claimed their workplace was diverse.
Again, the perception of workplace diversity varied within different demographics.
Age: 25 or younger—88% vs. 26–40 y/o—74%
Industry: software/IT—87% vs. manufacturing—71%
Annual income: $75,000 and greater—88% vs. $25,000 or less—74%
Education: Master’s degree—89% vs. no college degree—64%
Political affiliation: Democrat—87% vs. Republican—76%
Diversity and inclusion in the workplace are not a preference for younger generations. They’re a requirement.
Numerous studies show that, in contrast to previous generations, Gen Z employees value a sense of purpose more than a lucrative salary and job security. Gen Zers want to work for a higher cause and see making the world a better place as their long-term career goal. Consequently, they value companies that create a diverse, inclusive work environment and promote social responsibility.
Diversity doesn’t work without inclusion, right? Let’s find out.
- 73% of participants believed inclusion at work was important.
Interestingly, the way how respondents viewed the importance of workplace inclusion differed by their ethnicity, industry, and work experience. Take a look:
Ethnicity: ethnic minorities—87% vs. white—72%
Industry: software/IT—76% vs. manufacturing—65%
Work experience: 6+ years—77% vs. 1–2—63%
The above-presented percentage is the share of survey takers who considered workplace inclusion as important or very important.
Noteworthy, a full 16% of respondents without a college degree considered inclusion at work unimportant. As the study continues, you’ll see that—overall, based on many measures—this demographic group of participants valued the role of workplace diversity and inclusion the least compared to others.
- 85% of participants viewed their workplace as inclusive.
Respondents with the highest annual income ($75,000 or greater) showed a stronger tendency to classify their workplace as inclusive than those with the lowest earnings ($25,000 or less)—92% vs. 75%, respectively. The same could be observed in the case of education level. 89% of Master’s degree holders claimed their workplace was inclusive, while the percentage dropped to 64% for participants without a college degree.
We also collected opinions on how much emphasis is placed on diversity and inclusion in the workplace.
- 26% of respondents believed that there was too much emphasis on D&I at work. At the same time, exactly an equal percentage, 26%, claimed there wasn’t enough emphasis on the issues in question.
- 48% considered the amount of emphasis on D&I in the workplace to be just right.
- The greatest share of respondents who viewed the focus on D&I at work as insufficient included: ethnic minority representatives (34%), manufacturing workers (34%), and participants with an annual income of less than $25,000 (34%).
Declared political affiliation influenced the chosen answers, but not in the way you might expect. Republicans would be 1.4 times more willing to increase the focus on diversity and inclusion in the workplace than Democrats (32% vs. 23%, respectively). On the contrary, 36% of independents would limit the amount of emphasis on these matters.
Let’s move on to the pros and cons of workplace diversity.
Workplace diversity: pros & cons
In this section, we’ll focus on both the perceived positives and negatives of workplace diversity.
Let’s examine the bright side of diversity at work first.
Again, there were disparities in answers within different demographic groups. Participants’ assessment of the diverse workplace positives varied depending on their age, ethnicity, and education level.
In a diverse workplace, employees… [% of participants who agreed/strongly agreed with the given statement]
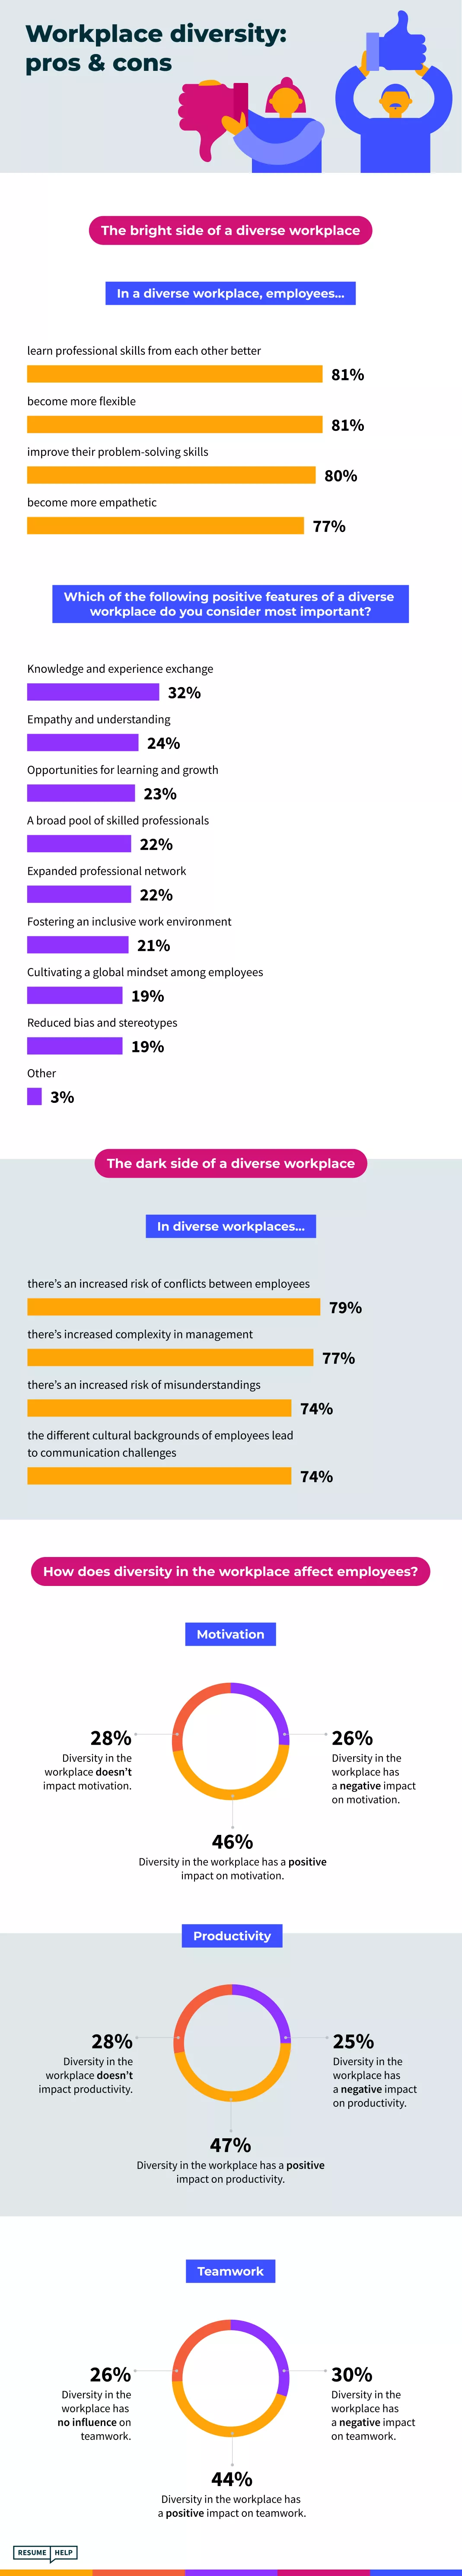
- learn professional skills from each other better – 81%
Age: 25 or younger—87% vs. 26–40 y/o | 41 or older—80%
Education: Master’s degree—84% vs. no college degree—62%
- become more flexible – 81%
Age: 25 or younger—88% vs. 26–40 y/o—77%
Education: Master’s degree—83% vs. no college degree—62%
- improve their problem-solving skills – 80%
Education: Master’s degree—85% vs. no college degree—60%
- become more empathetic – 77%
Age: 25 or younger—87% vs. 26–40 y/o—73%
Ethnicity: ethnic minority—85% vs. white—77%
Education: Master’s degree—84% vs. no college degree—58%
We also asked survey takers to choose up to two benefits of a diverse workplace they considered most important. The answers were the following:
- Knowledge and experience exchange – 32%
- Empathy and understanding – 24%
- Opportunities for learning and growth – 23%
- A broad pool of skilled professionals – 22%
- Expanded professional networks – 22%
- Fostering an inclusive work environment – 21%
- Cultivating a global mindset among employees – 19%
- Reduced bias and stereotypes – 19%
- Other – 3%
Delving deeper:
- Manufacturing workers (37%) valued opportunities for knowledge and experience sharing higher than employees of business and finance (24%) and education (24%) industries.
- Only 1 in 10 participants without a college degree considered empathy and understanding as the most essential workplace diversity advantages.
- Respondents working in big companies (501+ employees) viewed developing empathy and understanding as more important than those working in small companies (1–50 employees)—32% vs. 19%, respectively.
- For ethnic minority representatives (34%), opportunities for learning and growth carried greater weight than for white participants (22%).
- Participants classifying themselves as a hybrid of white and blue-collar workers (36%) appreciated expended professional networks more than other demographic groups.
- 29% of education industry workers believed fostering an inclusive work environment was the greatest advantage of a diverse workplace.
There are two sides to every coin, though. Let’s change the perspective and focus on the possible disadvantages of diversity at work.
In diverse workplaces… [% of participants who agreed/strongly agreed with the given statement]
- there’s an increased risk of conflicts between employees – 79%
Ethnicity: ethnic minority—89% vs. white—78%
Type of work: blue collar—88% vs. white collar—77%
Industry: manufacturing—88% | education—86% vs. business & finance—72%
Company size: 201–500 employees—87% vs. 1–50—69%
Annual income: $50,000–74,999—84% vs. $25,000–49,999—69%
Education: Master’s degree—82% vs. no college degree—66%
- there’s increased complexity in management – 77%
Annual income: $50,000–74,999—83% vs. less than $25,000—66%
Education: Bachelor’s degree—80% vs. no college degree—65%
- there’s an increased risk of misunderstandings – 74%
- the different cultural backgrounds of employees lead to communication challenges – 74%
Age: 25 or younger—84% vs. 41 or older—69%
Ethnicity: ethnic minority—89% vs. white—73%
Company size: 51–200 employees—80% | 201–500—78% vs. 1–50—67%
Annual income: $50,000–74,999—84% vs. less than $25,000—61%
Next, how does diversity in the workplace affect employees? Let’s find out.
- 46% of respondents believed workplace diversity had a positive impact on employees’ motivation.
The greatest share of answers supporting such a view came from participants with an annual income of $25,000–49,999 (56%), software/IT industry workers (55%), and survey takers employed at companies hiring 201–500 employees (53%). On the other hand, respondents working in the education sector (33%) and those without a college degree (31%) claimed that diversity in the workplace had a negative impact on employees’ motivation.
- 47% of participants viewed the influence of workplace diversity on employees’ productivity as positive.
Still, not everyone was convinced. The independents (32%), no college degree holders (32%), and ethnic minority representatives (31%) believed that diversity in the workplace had a negative impact on employees’ productivity.
- 44% of survey takers claimed that workplace diversity positively affected teamwork.
The percentage was even higher for participants aged 25 or younger (59%). In contrast, education industry workers (52%) considered the influence of workplace diversity on teamwork as negative.
Overall, the perceived benefits of a diverse workplace seem to outweigh the potential challenges or risks.
Also—
There’s a link between diversity, equity, and inclusion, and job satisfaction.
“DEI and job satisfaction are closely linked. DEI is not just a program or a policy, but rather three separate components that span the entire employee lifecycle. Without embedded inclusive practices and accountabilities to said embedded inclusive practices in the organizational culture, employees will not have the same level of job satisfaction as they would if DEI work was prioritized and intentional”.
–Cinnamon Clark, HR expert at McLean & Company
After all, when everyone is different, we all belong.
Inclusive recruitment: best practices
We also asked respondents a few questions on inclusive recruitment best practices.
The views significantly differed by participants’ education levels. There were also disparities in answers given by other demographic groups as well, depending on the industry, company size, and annual income of respondents.
Below each highlighted key finding of the study, you can see the percentage of survey respondents from different demographics who agreed with the presented opinion.
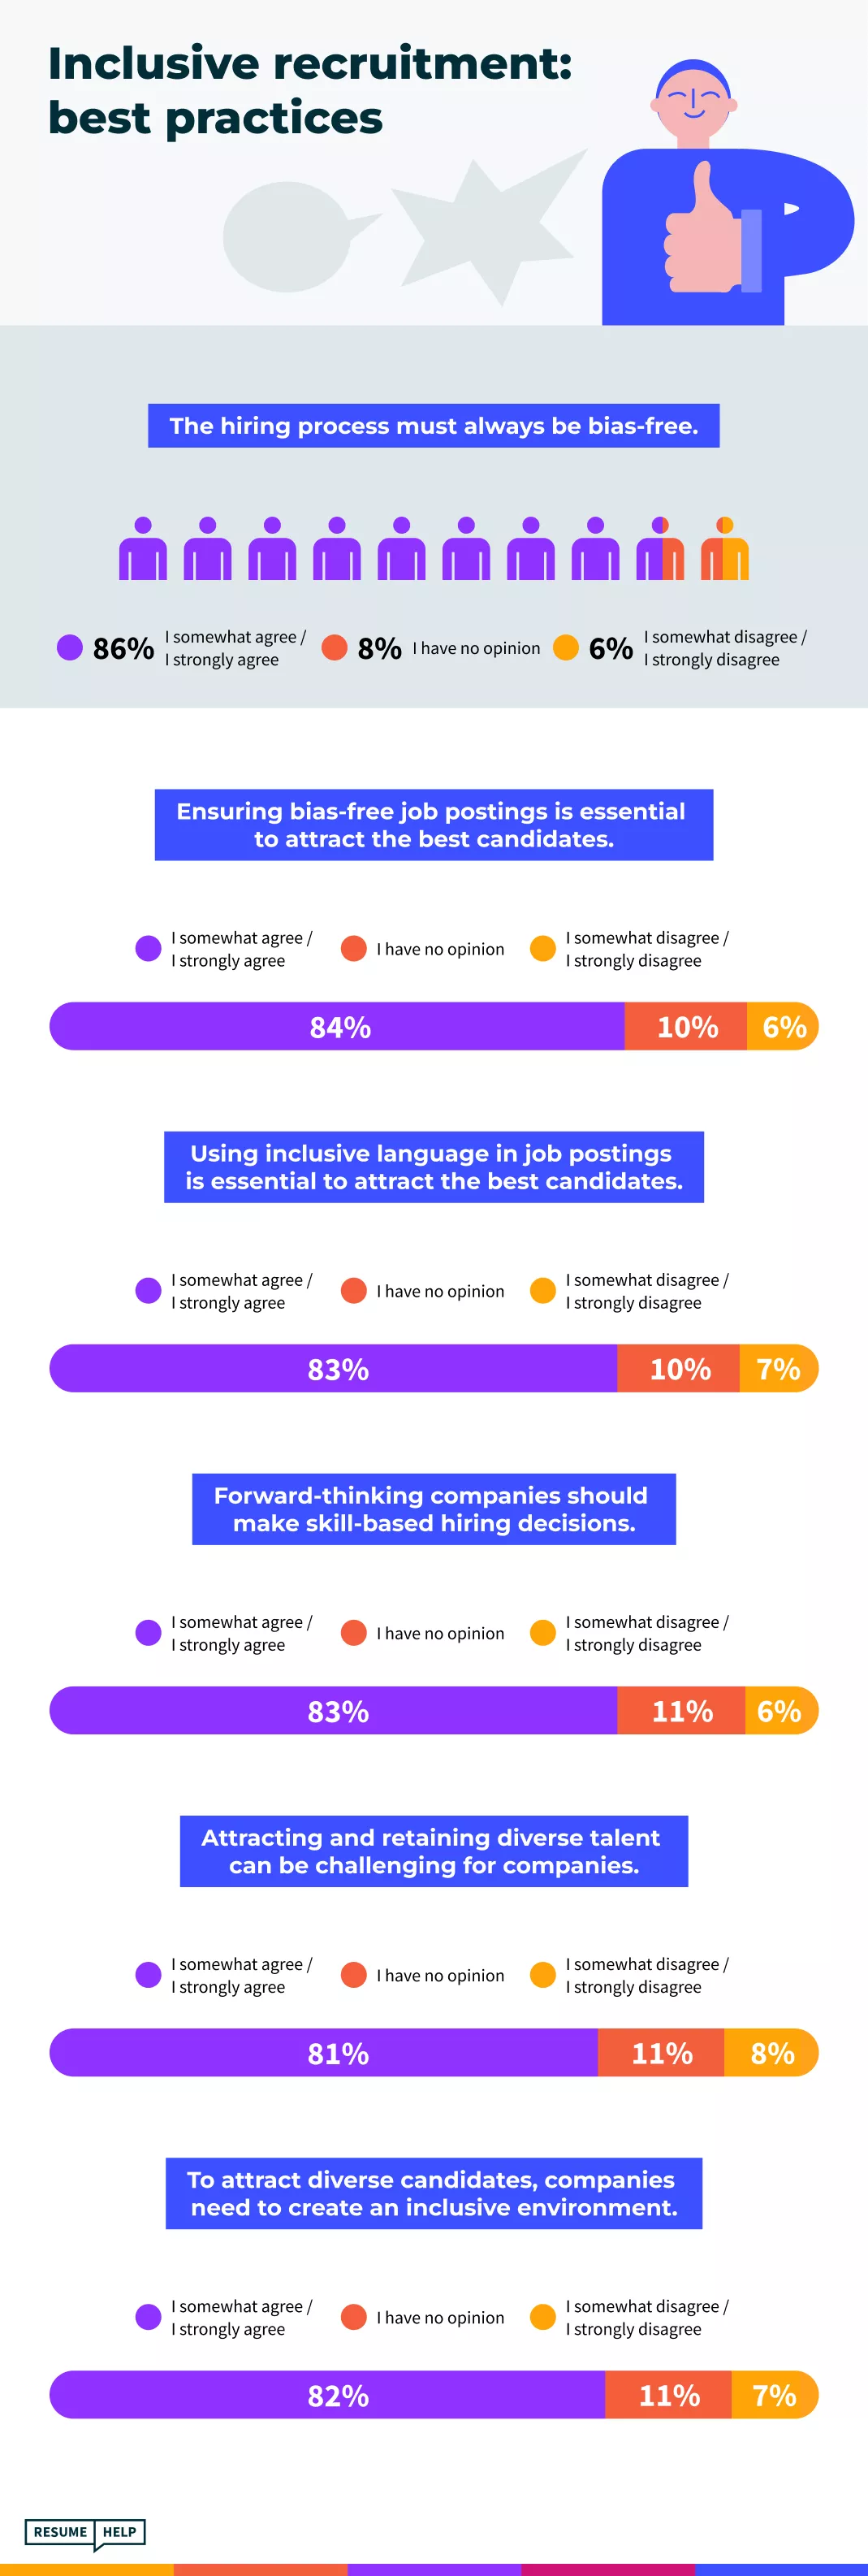
- Almost 9 in 10 (86%) survey takers believed the hiring process must always be bias-free.
Industry: manufacturing—93% vs. business and finance—81%
Company size: 201–500 employees—91% vs. 1–50—79%
Annual income: $75,000 or greater—89% vs. $25,000–49,999—81%
Education: Master’s degree | Bachelor’s degree—88% vs. no college degree—69%
[*23% of participants without a college degree disagreed with the given view.]
- For 84% of participants, ensuring bias-free job postings was essential to attract the best candidates.
Education: Master’s degree—86% vs. no college degree—60%
[*24% of participants without a college degree disagreed with the given view.]
- 83% of respondents considered using inclusive language in job postings as essential to attracting the best candidates.
Education: Master’s degree—87% vs. no college degree—66%
[*21% of participants without a college degree disagreed with the given view.]
- 83% of the surveyed believed that forward-thinking companies should make skill-based hiring decisions.
Type of work: blue collar—92% vs. white collar—82%
Company size: 501+ employees—87% vs. 1–50—77%
Annual income: $75,000 or greater—88% vs. $25,000 or less—73%
Education: Master’s degree—87% vs. no college degree—66%
[*21% of participants without a college degree disagreed with the given view.]
- 81% of respondents expressed concerns that attracting and retaining diverse talent could be challenging for companies.
Company size: 51–200 employees—88% vs. 501+—77%
- 82% of participants agreed that companies needed to create an inclusive environment to attract diverse candidates.
Type of work: blue collar—94% vs. white collar—80%
Company size: 201–500 employees—88% vs. 1–50—71%
Annual income: $75,000 or greater—90% vs. $25,000 or less—72%
Education: Master’s degree—89% vs. no college degree—61%
[*23% of participants without a college degree disagreed with the given view.]
Let’s briefly sum up.
The bigger the companies respondents work for, the higher their income, and the higher their educational level, the more supportive their attitude toward inclusive, bias-free hiring is.
The labor market is a fast-changing picture, so what was true yesterday may not stay the same tomorrow. Nothing can be taken for granted. The rule also applies to the workforce itself, which is becoming ever more diverse.
According to official US Census projections, by 2045, the nation will be “minority white,” with whites accounting for just 49.7% of the total population.
Thanks to inclusive hiring, the talent pool broadens. As a result, HR specialists can find the best professional fit for companies. Everybody wins.

Stand Out with a Professional Resume!
Prejudices and stereotypes at work
Let’s focus on prejudices and stereotypes at work now.
Participants were asked to share their opinions on making assumptions based on several non-work-related factors.
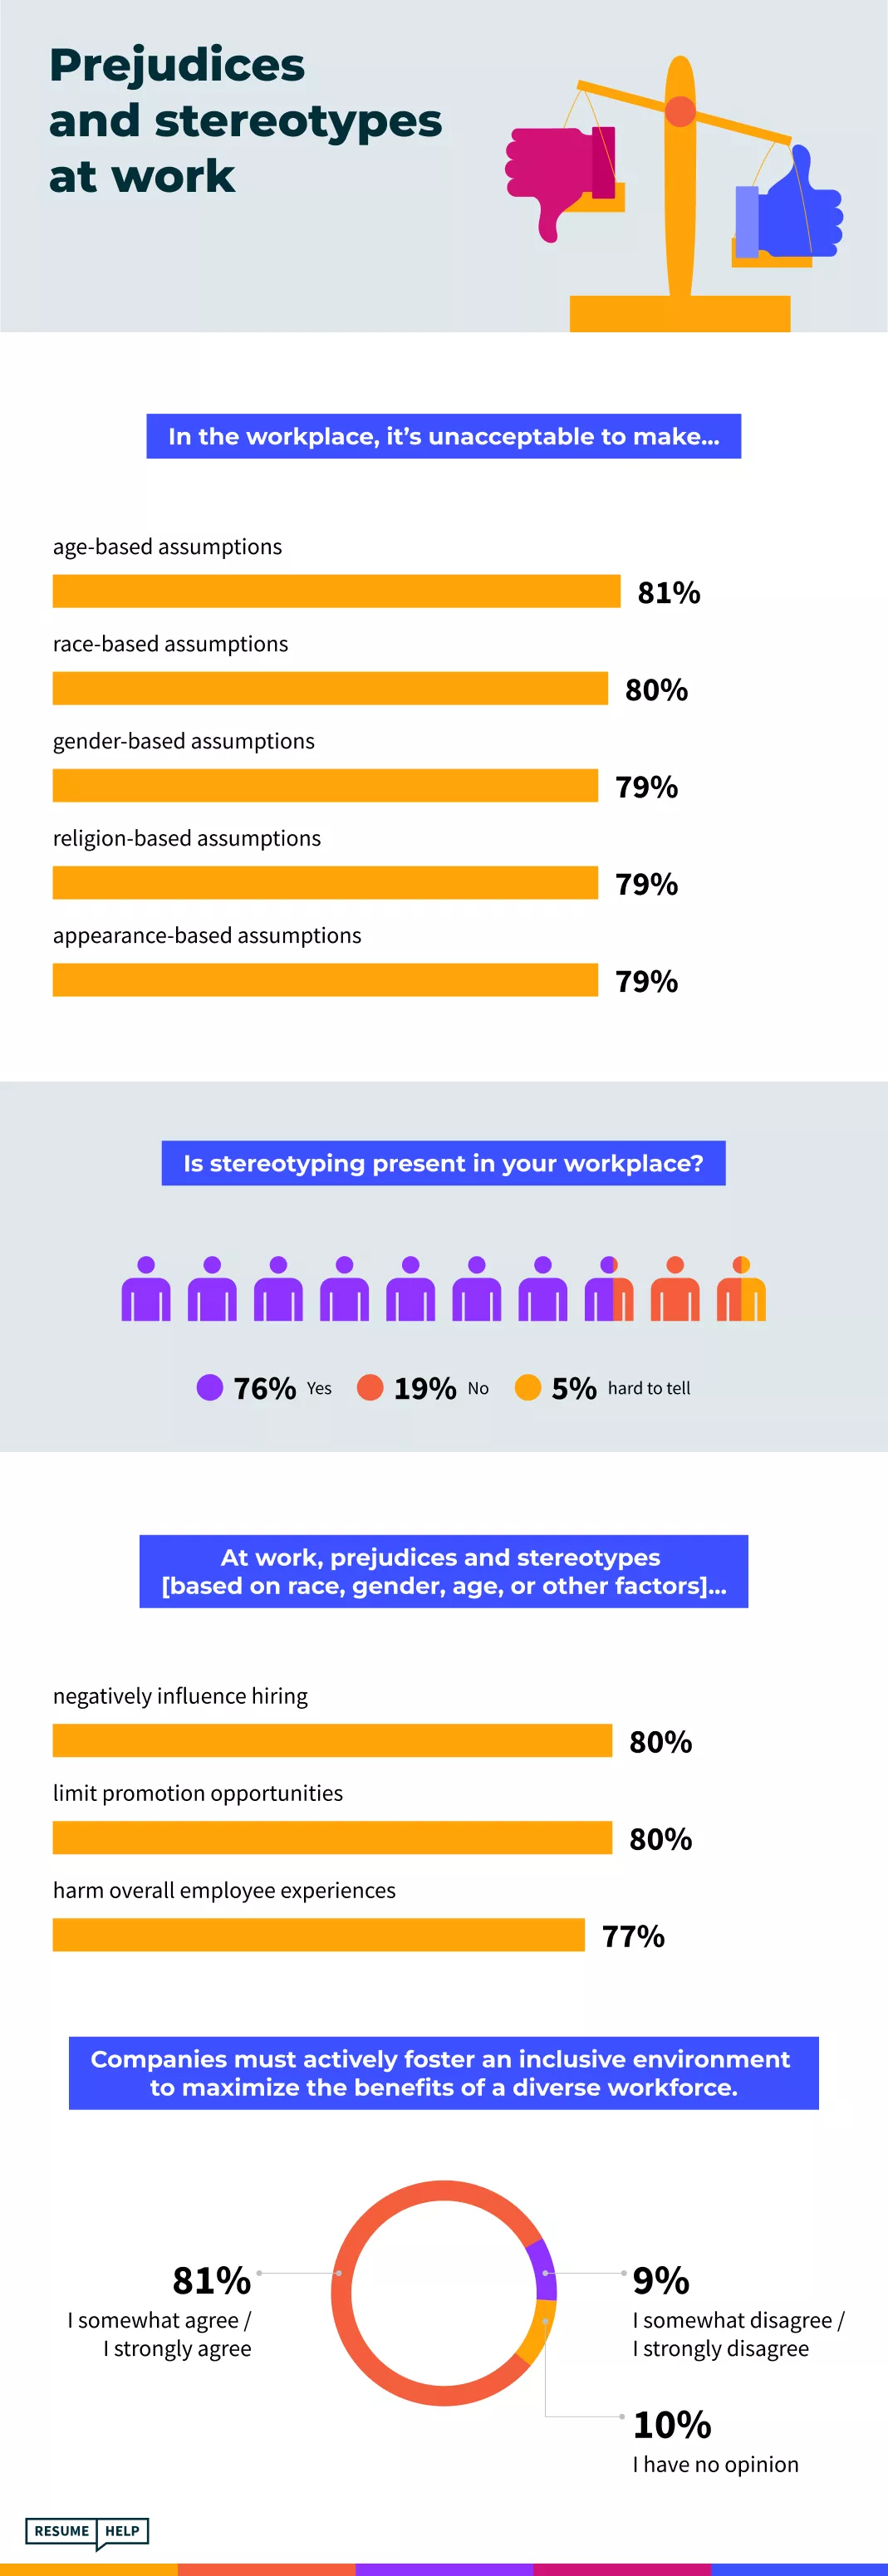
In the workplace, it’s unacceptable to make…
- age-based assumptions – 81%
Ethnicity: ethnic minority—90% vs. white—81%
Industry: manufacturing—90% vs. education—77%
Company size: 201–500 employees—85% vs. 1–50—73%
Annual income: $75,000 or greater—89% vs. $49,999 or less—76%
Education: Master’s degree—85% vs. no college degree—66%
- race-based assumptions – 80%
Industry: manufacturing—90% vs. education—74%
Company size: 201–500 employees—84% vs. 1–50—71%
Annual income: $75,000 or greater—85% vs. 25,000–49,999—74%
Education: Master’s degree—85% vs. no college degree—64%
- gender-based assumptions – 79%
- religion-based assumptions – 79%
Company size: 501+ employees—84% vs. 1–50—71%
Annual income: $75,000 or greater—85% vs. $25,000 or less—75%
Education: Bachelor’s degree—83% vs. no college degree—63%
- appearance-based assumptions – 79%
Annual income: $75,000 or greater—85% vs. $25,000 or less—69%
Education: Master’s degree—89% vs. no college degree—69%
The above data once again prove that there’s a link between respondents’ company size, annual income, and educational level and the way they approach workplace diversity and inclusion.
But clearly, the majority of people do not accept making non-work-related assumptions in professional life.
Still, at the same time, a full 76% of participants admitted that stereotyping was present in their workplace. The share was even larger for ethnic minority representatives (92%), education industry workers (87%), respondents with an annual income of $25,000 or less (87%), and no college degree holders (87%).
We also asked respondents about the impact of prejudices and stereotypes—based on race, gender, age, or other factors—on the workplace.
- 80% of participants believed prejudices and stereotypes negatively influence hiring. The percentage was even higher in the answers given by blue-collar workers (92%).
- Also, 80% considered prejudices and stereotypes as factors limiting promotion opportunities.
- 77% claimed prejudices and stereotypes harmed the overall employee experience. The share was noticeably bigger in responses from blue-collar workers (88%) and education industry employees (87%).
Inclusive work environments are the answer. Most respondents agreed that skills, experience, and positive work habits should speak louder than our skin color, gender, or age.
- 81% of respondents believed that companies must actively foster an inclusive environment to maximize the benefits of a diverse workforce.
Let’s move on to investigate the topic of workplace discrimination.
First-hand experience with discrimination at work
Our respondents shared their personal experiences with discrimination at work.
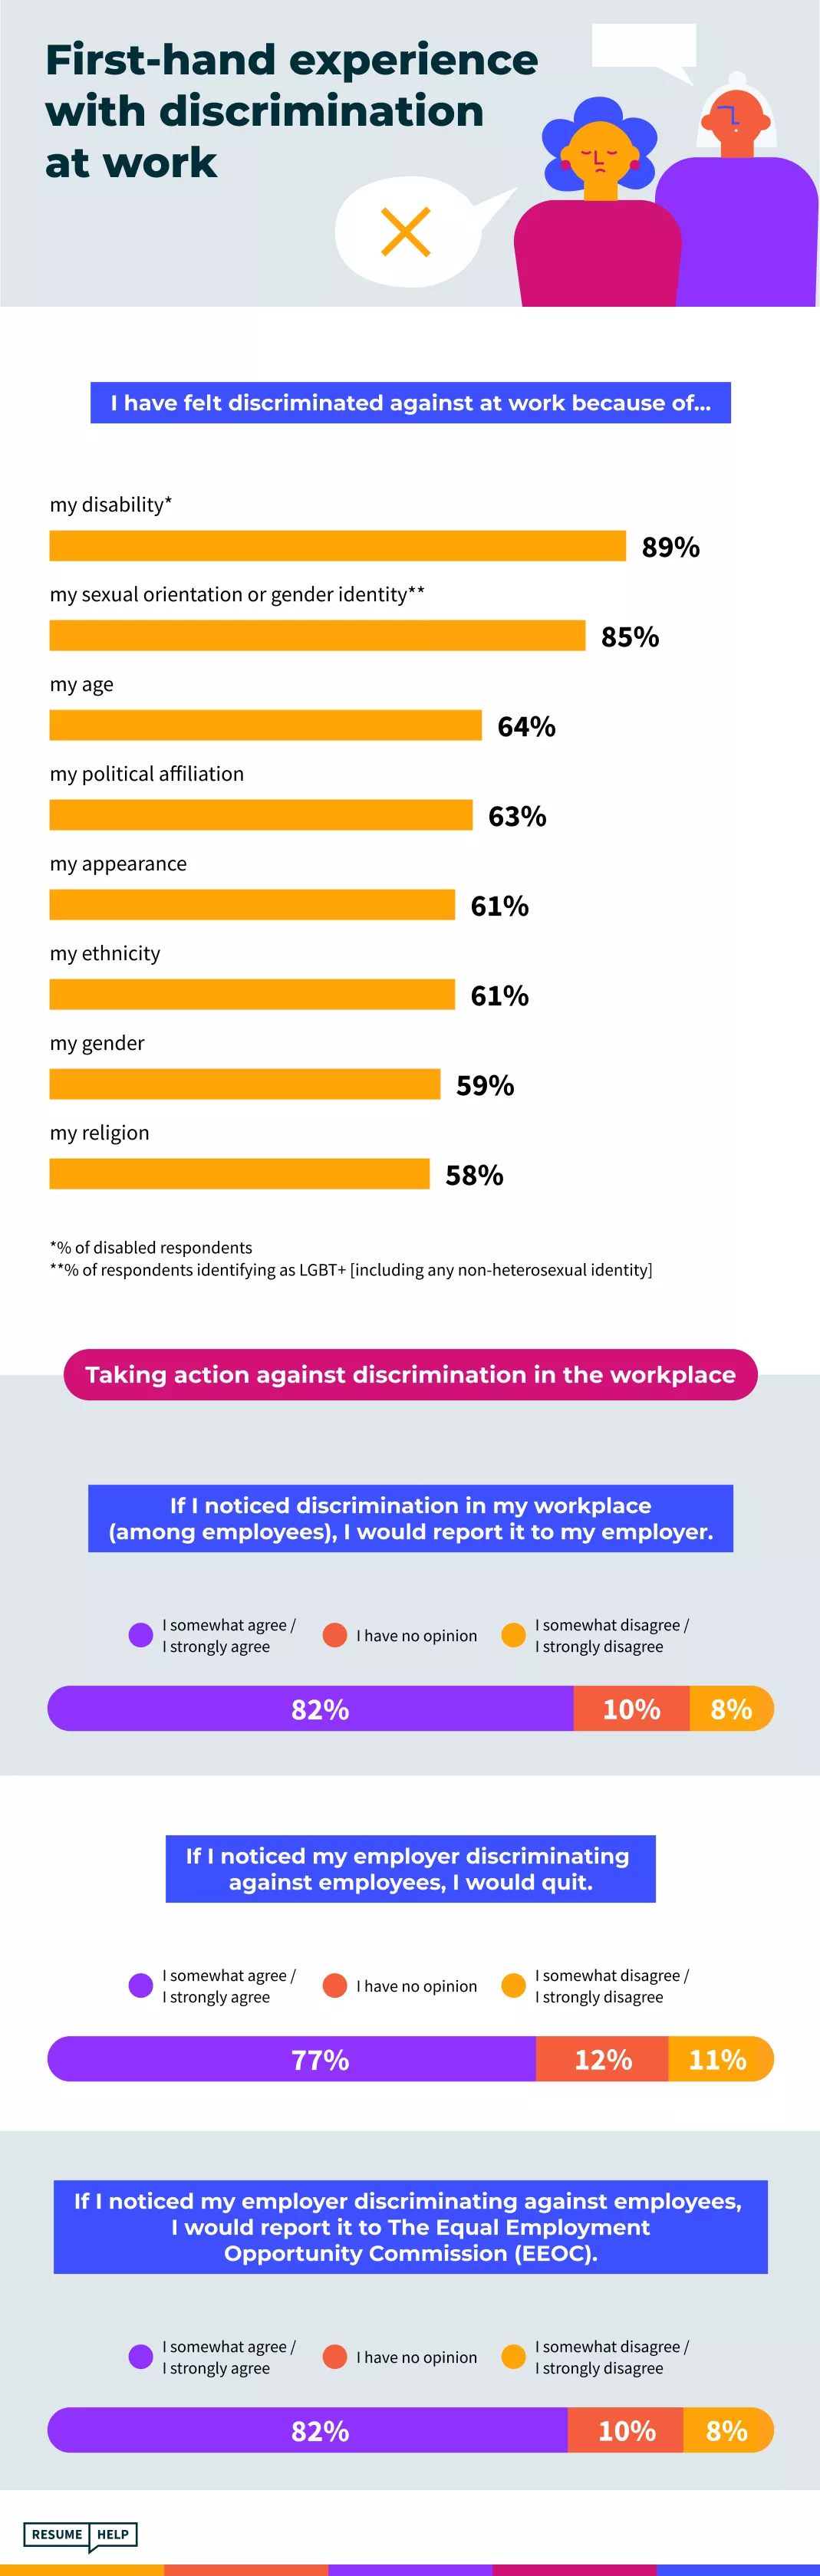
I have felt discriminated against at work because of…
- my age – 64% [education – 81%]
- my political affiliation – 63%
- my appearance – 61% [education – 75%]
- my ethnicity – 61% [ethnic minorities – 72%]
- my gender – 59%
- my religion – 58%
Interestingly, there were no significant differences between answers given by female (57%) and male (61%) respondents regarding discrimination based on gender.
Organization size matters, though. Respondents working for large companies (501+ employees) seemed to enjoy a much more tolerant workplace environment than those hired in small companies (1–50 employees). Respondents working for smaller companies reported being:
- 1.8 times more likely to experience discrimination based on their religion
- 1.7 times more likely to experience discrimination based on their appearance
- 1.5 times more likely to experience discrimination based on their political affiliation
The numbers speak for themselves. Discrimination at work is still common.
The situation is even more dramatic for the disabled and people identifying as LGBTQ+ [including any non-heterosexual identity]. Our study findings leave no doubt about that.
- 89% of the disabled participants claimed they had felt discriminated against at work because of their disability. There was a disparity in answers given by men (93%) and women (82%).
- 85% of respondents identifying as LGBTQ+ admitted they had felt discriminated against at work because of their sexual orientation or gender identity. Education (95%) and business and finance (94%) industries turned out to be the most intolerant.
Next, let’s find out how our research participants felt about taking action against discrimination in the workplace. Below, you can see the statements and the percentage of respondents who agree with the given opinions.
- If I noticed discrimination in my workplace (among employees), I would report it to my employer. – 82%
Gender: females—86% males—78%
Age: 25 or younger—89% vs. 41 or older—80%
Industry: manufacturing—84% / education—84% vs. business & finance—74%
Company size: 51–200 employees—87% vs. 1–50—77%
Education: Bachelor’s degree—85% vs. no college degree—67%
- If I noticed my employer discriminating against employees, I would quit. – 77%
Work experience: 1-2 years—86% vs. 6+—72%
Annual income: $75,000 or greater—81% vs. $25,000 or less—69%
Education: Master’s degree—81% vs. no college degree—57%
[*20% of participants without a college degree disagreed with the given view.]
- If I noticed my employer discriminating against employees, I would report it to The Equal Employment Opportunity Commission (EEOC). – 82%
Annual income: $50,000-74,999—88% vs. $25,000 or less—68%
Education: Bachelor’s degree—85% vs. no college degree—60%
[*27% of participants without a college degree disagreed with the given view.]
Let’s move on to a summary of our findings.
Views on diversity & inclusion in the modern workplace
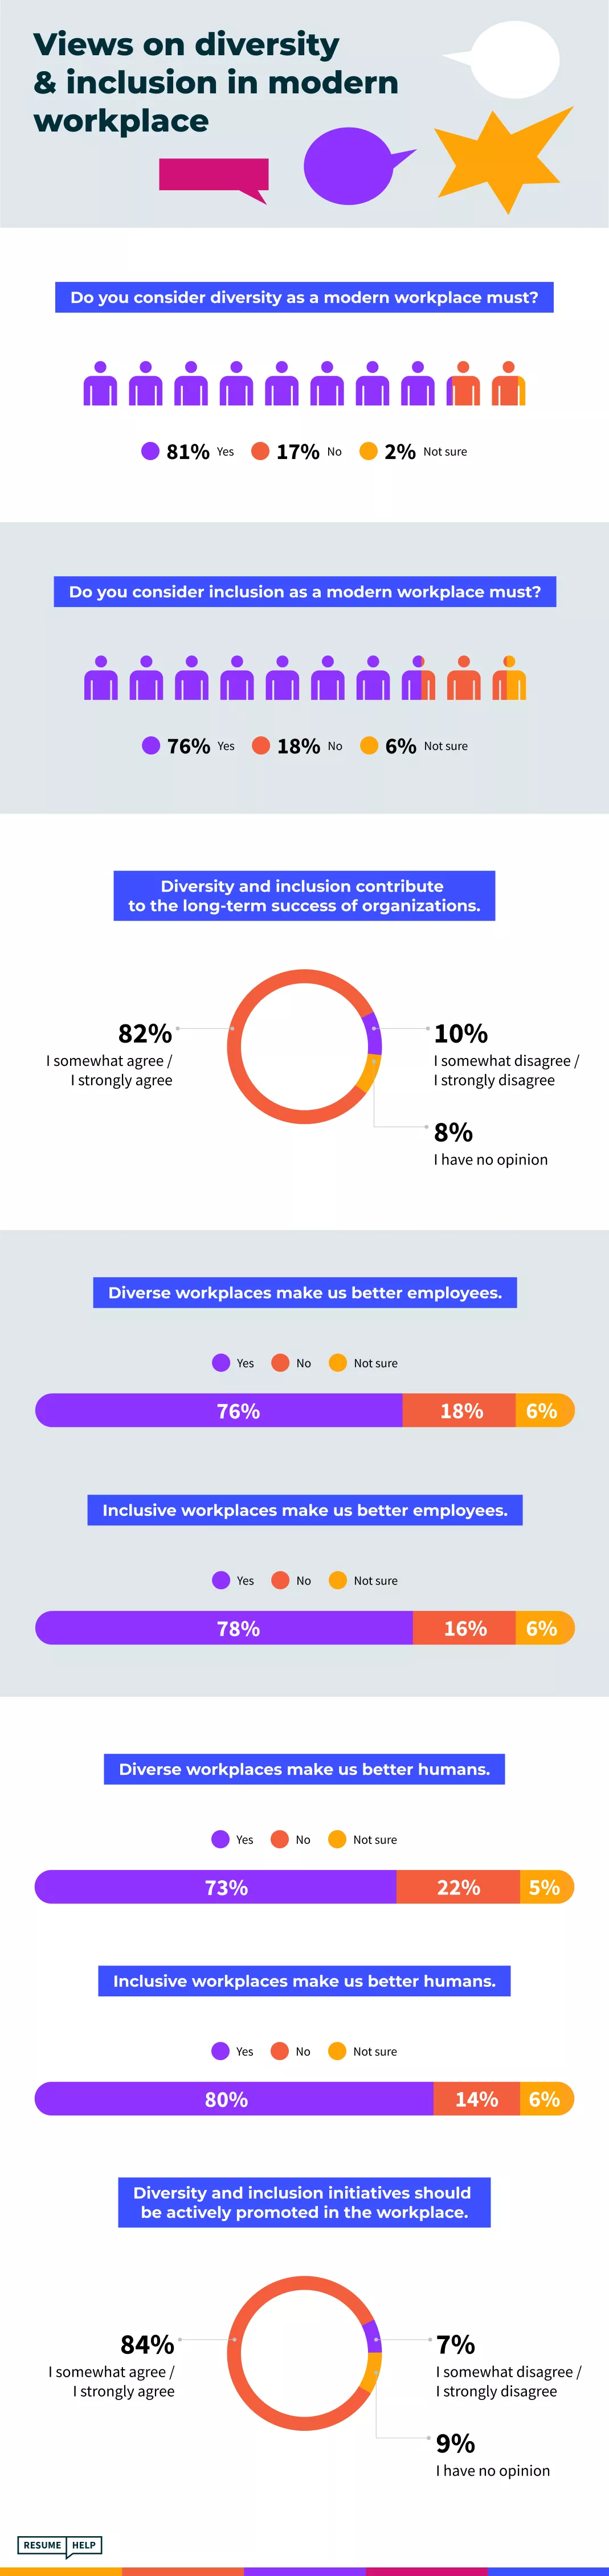
Here’s a snapshot of views of the role of diversity and inclusion in the modern workplace.
- 81% of respondents considered diversity as a modern workplace must.
- 76% viewed inclusion as a modern workplace must.
- 82% claimed diversity and inclusion contribute to the long-term success of organizations.
- 80% believed inclusive workplaces make us better people.
- 84% were of the opinion that diversity and inclusion initiatives should be actively promoted in the workplace. Participants aged 25 or younger (93%) and Master’s degree holders (93%) were even more positive about promoting D&I at work.
Diversity and inclusion are not just trending discussion topics. They should be workplace standards, setting which is in our common interest.
As the world continues to evolve and progress, society is becoming increasingly aware of the importance of D&I at work. Still, that doesn’t mean we must rest on our laurels.
It’s never so good that it couldn’t be better.
Methodology
The findings presented were obtained by surveying 1070 respondents online via a bespoke polling tool. They were asked questions about diversity and inclusion at work. These included yes/no questions, scale-based questions relating to levels of agreement with a statement, questions that permitted the selection of multiple options from a list of potential answers, and a question that permitted open responses. All respondents included in the study passed an attention-check question.
Limitations
The data we are presenting relies on self-reports from respondents. Everyone who took our survey read and responded to each question without any research administration or interference. We acknowledge there are many potential issues with self-reported data, like selective memory, telescoping, attribution, or exaggeration.
Sources
- Abdou, A., “Job Satisfaction Looks Different in 2024 – Here’s Why”
- Boschma, J., Wolfe, D., Krishnakumar, P., et al., “Census Release Shows America Is More Diverse and More Multiracial than Ever”
- “Diversity and Inclusion (D&I) – Global Strategic Business Report”
- Mastantuono, M., “Why DEI Matters More Than Ever”
- “McKinsey & Company, Diversity, Equity and Inclusion Lighthouses 2024”
- “McLean & Company’s 2024 HR Trends Report”
- Miller, J., “For Younger Job Seekers, Diversity and Inclusion in the Workplace Aren’t a Preference. They’re a Requirement”
- Minkin, R., “Diversity, Equity and Inclusion in the Workplace”
Fair use statement
Want to share the findings of our research? Go ahead. Feel free to use our images and information wherever you wish. Just link back to this page, please—it will let other readers get deeper into the topic. Additionally, remember to use this content exclusively for non-commercial purposes.
ResumeHelp’s Editorial Note
Our editorial team at ResumeHelp carefully reviews each article to ensure it meets our high-quality standards and aligns with current industry trends. We are committed to providing reliable, expert-driven career guidance that empowers job seekers worldwide. Our advice is supported by research and industry standards, which is why ResumeHelp is trusted and positively reviewed by thousands of users. See our editorial guidelines to learn how diligently we review each piece of content.